Microk8s is a framework designed to start a Kubernetes cluster. According to Canonical, which maintain the project, it is production ready, requires low maintenance and the Kubernetes cluster uses minimal resources.
Microk8s is cross-platform and is available on Windows, Linux and macOS. One feature that is really cool is that it comes with a plugin system to enable some features in the cluster lovely easy.
It also supports ARM if you want to run a Kubernetes cluster on Raspberry Pies. However, you’ll need to make sure you use fast storage.
Installation
Installing Microk8s is very easy. On Ubuntu, which comes with snap presintalled by default, you just have to run:
sudo snap install microk8s --classic
The --classic flag is required because Microk8s needs access to files on the
system.
If you uses an unprivileged user (and you should!), you’ll need to add your user
to the microk8s group. In my case, the user is polyedre:
sudo usermod -a -G microk8s lucas
sudo chown -f -R lucas ~/.kube
And that’s it! Your cluster should be running. You can check its status with:
$ microk8s status
microk8s is running
high-availability: no
  datastore master nodes: 127.0.0.1:19001
  datastore standby nodes: none
addons:
  enabled:
    ha-cluster           # Configure high availability on the current node
  disabled:
    ambassador           # Ambassador API Gateway and Ingress
    cilium               # SDN, fast with full network policy
    dashboard            # The Kubernetes dashboard
    dashboard-ingress    # Ingress definition for Kubernetes dashboard
    dns                  # CoreDNS
    fluentd              # Elasticsearch-Fluentd-Kibana logging and monitoring
    gpu                  # Automatic enablement of Nvidia CUDA
    helm                 # Helm 2 - the package manager for Kubernetes
    helm3                # Helm 3 - Kubernetes package manager
    host-access          # Allow Pods connecting to Host services smoothly
    inaccel              # Simplifying FPGA management in Kubernetes
    ingress              # Ingress controller for external access
    istio                # Core Istio service mesh services
    jaeger               # Kubernetes Jaeger operator with its simple config
    kata                 # Kata Containers is a secure runtime with lightweight VMS
    keda                 # Kubernetes-based Event Driven Autoscaling
    knative              # The Knative framework on Kubernetes.
    kubeflow             # Kubeflow for easy ML deployments
    linkerd              # Linkerd is a service mesh for Kubernetes and other frameworks
    metallb              # Loadbalancer for your Kubernetes cluster
    metrics-server       # K8s Metrics Server for API access to service metrics
    multus               # Multus CNI enables attaching multiple network interfaces to pods
    openebs              # OpenEBS is the open-source storage solution for Kubernetes
    openfaas             # OpenFaaS serverless framework
    portainer            # Portainer UI for your Kubernetes cluster
    prometheus           # Prometheus operator for monitoring and logging
    rbac                 # Role-Based Access Control for authorisation
    registry             # Private image registry exposed on localhost:32000
    storage              # Storage class; allocates storage from host directory
    traefik              # traefik Ingress controller for external access
That is a lot of plugins, and many are added each months.
Plugins
Let’s investigate in some of the plugins.
Dashboard
The dashboard plugin allows you to have an overview of all cluster resources directly from a web interface. All the addons can be enabled with:
microk8s enable <addon-name>
So the command for the dashboard is obviously:
microk8s enable dashboard
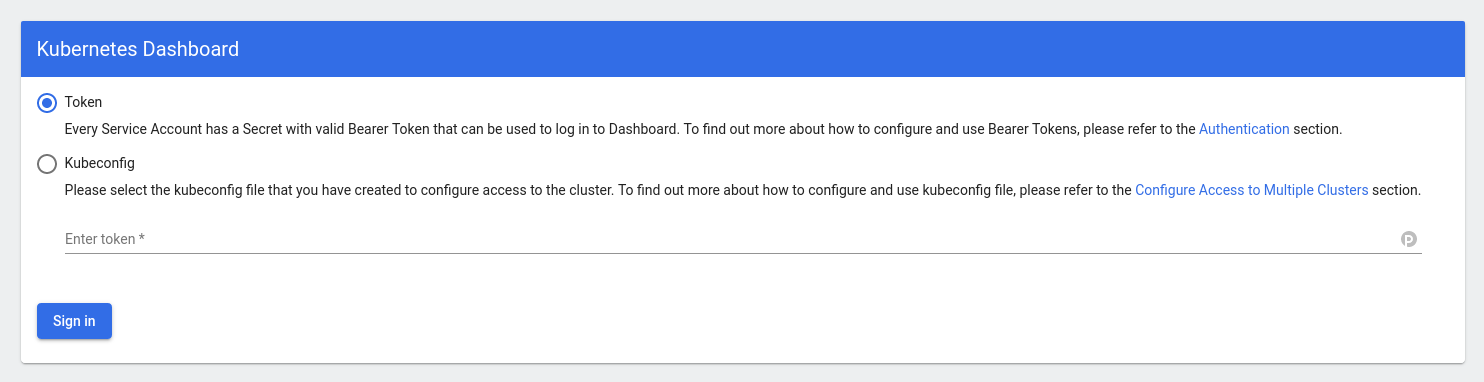
To access the dashboard, just run:
$ microk8s dashboard proxy
Checking if Dashboard is running.
Dashboard will be available at https://127.0.0.1:10443
Use the following token to login:
eyJhbGciOiSSUzI1NiIsImtpZCI6Im5ZZ2VoOElDSUh4aS1LcHk4aXppeHU0eTlpRlJMNnN5eEwtX2drMzVteFkifQ.eyJpc3MiOiJrdWJlcm5ldGVzL3NlcnZpY2VhY2NvdW50Iiwia3ViZXJuZXRlcy5pby9zZXJ2aWNlYWNjb3VudC9uYW1lc3BhY2UiOiJrdWJlLXN5c3RlbSIsImt1YmVybmV0ZXMuaW8vc2VydmljZWFjY291bnQvc2VjcmV0Lm5hbWUiOiJkZWZhdWx0LXRva2VuLXQ4NHh4Iiwia3ViZXJuZXRlcy5pby9zZXJ2aWNlYWNjb3VudC9zZXJ2aWNlLWFjY291bnQubmFtZSI6ImRlZmF1bHQiLCJrdWJlcm5ldGVzLmlvL3NlcnZpY2VhY2NvdW50L3NlcnZpY2UtYWNjb3VudC51aWQiOiIwMTEzYmQ4MS1kOTc4LTRmMGEtODRmMi0zYTNkMDg5YWRlMDUiLCJzdWIiOiJzeXN0ZW06c2VydmljZWFjY291bnQ6a3ViZS1zeXN0ZW06ZGVmYXVsdCJ9.Jsm8JgHeVftxcfCVUezFkvr6pYp_h1uAUxXwPiAc88cPfSTWRfpss3ysNpDm3eQd6NyEffM3YkMnUYmhqjQ04gIIwik4qmtkdzgxOmeCRX0w-TpJG5_i-FZHadIxnHX2_3yWQYpkDFO3Y3v8EWZrkm9VEJNn8wzGu25PQG2zPTC63CgE5n-WsTW2UhUk_jhuXHYyveJyz1IXhj3dmH6w2oH_d7qRmkB39jGCf8qA7qQ8I_ohfYuKEeEPEbUSFZl7JITIRPlAV9C43fzdx7HsPZQNPGix5nMX3VM020f17niWh0hiPHoMRHKj9fWSrTrdLmL1BCAjbsrA2hssqafIsP
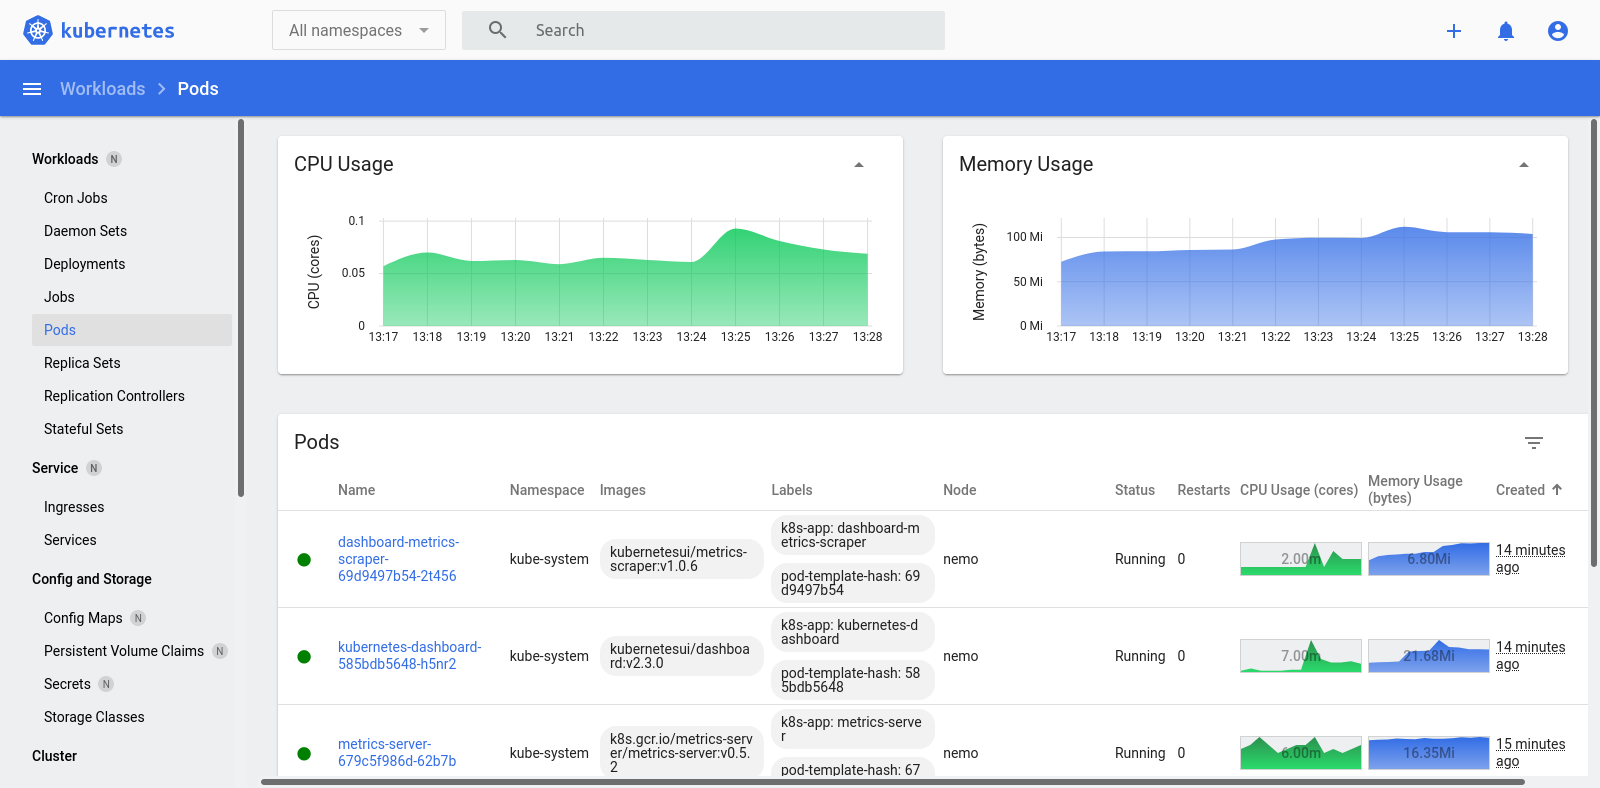
In the web inteface, connect with the token. You can now monitor the status of your workload, performance, etc.